





Pickup Location Adoption: Rural vs Suburban vs Dense Metro
Key Takeaways
- When stores offer FedEx and UPS pickup at checkout, 10% to 15% of shoppers choose it nationwide.
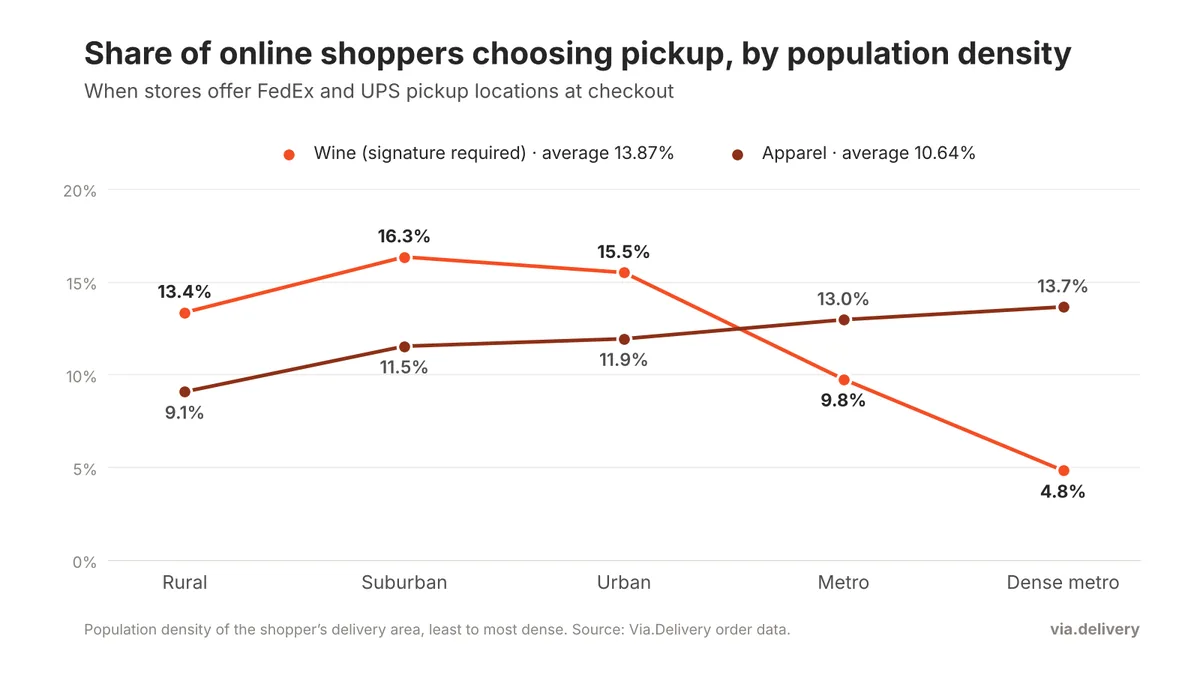
- Apparel: adoption rises steadily with population density, from 9.1% in rural areas to 13.7% in dense metros (average 10.64%).
- Wine (signature required): adoption peaks in the suburbs at 16.3% and urban areas at 15.5%, then drops to 9.8% in metros and 4.8% in dense metros (average 13.87%).
- Wine buyers in rural areas still choose pickup 13.4% of the time, more than apparel buyers anywhere except dense metros.
- The two curves cross between urban and metro areas, so the right pickup message depends on what you sell and where your customers live.
Share:
The data at a glance
The analysis looks at online orders from stores that offer pickup locations next to home delivery at checkout. Each delivery area was placed in one of five groups by its population density, from rural to dense metro, and we measured what share of shoppers in each group chose a pickup location.
| Population density | Apparel | Wine (signature required) |
|---|---|---|
| Rural | 9.1% | 13.4% |
| Suburban | 11.5% | 16.3% |
| Urban | 11.9% | 15.5% |
| Metro | 13.0% | 9.8% |
| Dense metro | 13.7% | 4.8% |
| Average | 10.64% | 13.87% |
Share of online shoppers choosing a pickup location at checkout. The averages are overall figures for each category, so they differ from a simple average of the five rows.
Why split by density at all? The Census Bureau counts 80% of Americans as living in urban areas, but its definition of "urban" starts at just 5,000 people or 2,000 housing units. A town of 6,000 and Manhattan land in the same bucket. Pickup behavior is very different across that range, so a finer split tells you more.
Why split by density at all? The Census Bureau counts 80% of Americans as living in urban areas, but its definition of "urban" starts at just 5,000 people or 2,000 housing units. A town of 6,000 and Manhattan land in the same bucket. Pickup behavior is very different across that range, so a finer split tells you more.
Apparel: the denser the area, the more shoppers choose pickup
For apparel, adoption climbs at every step, from 9.1% in rural areas to 13.7% in dense metros. That's half again as many shoppers choosing pickup in the densest areas as in the most rural ones.
The likely reasons (our reading of the pattern, not something the data measures directly):
The likely reasons (our reading of the pattern, not something the data measures directly):
- Shared entrances and lobbies. In apartment buildings, a package left at the door or in the lobby is exposed to everyone who walks past. A store counter is safer.
- Locations within walking distance. In dense areas, a pharmacy or convenience store that accepts packages is often on the way home, so pickup costs the shopper almost nothing.
- Small, easy-to-carry parcels. A shirt or a pair of shoes fits in a bag, so collecting it on foot or by transit is no problem.
Wine: highest in the suburbs, lowest in dense metros
Wine follows a different curve. Adoption is already high in rural areas (13.4%), peaks in the suburbs (16.3%) and urban areas (15.5%), then falls to 9.8% in metros and 4.8% in dense metros.
The high end makes sense: every wine shipment needs an adult (21+) to sign, and most deliveries arrive on weekdays while people are at work. In suburban and urban areas, where many people drive to work and run errands by car, picking up a box at a nearby location is easy.
Why does it drop so sharply in metros and dense metros? The data shows the pattern, not the reason, but our read is that it reflects driving versus walking habits:
- Wine is heavy. A 6- or 12-bottle box is easy to put in the trunk, but in a place like Manhattan, few people drive to run errands, and walking or taking the subway home with a case of wine doesn't make much sense.
- Someone is there to sign. Many buildings in dense cities have a concierge or doorman, which can take the "nobody home to sign" problem out of home delivery.
The national picture: 10–15% choose pickup
Across the country, 10% to 15% of shoppers choose pickup when stores offer it at checkout. On the map, each circle is an area: its size shows how many customers ordered there, and its color shows what share of them chose pickup instead of home delivery, from green (under 10%) through yellow (10–15%) to red (15% or more).
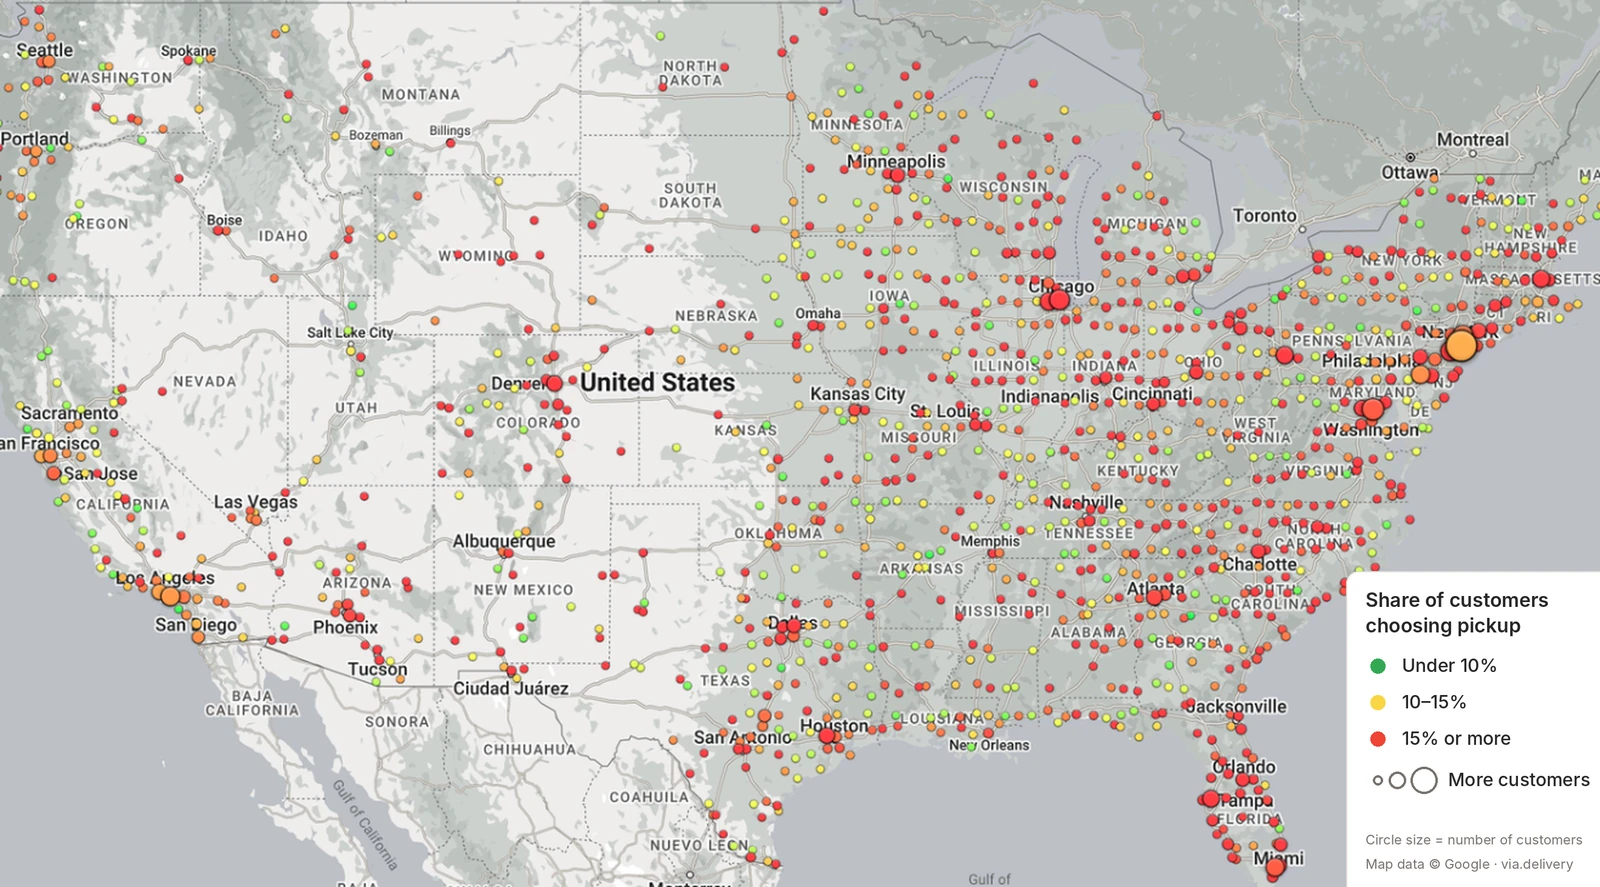
Two things stand out:
- Pickup isn't only a big-city habit. Areas at 15% or more appear across the South, the Midwest and the Mountain West, not just around New York, Chicago or Los Angeles.
- Coverage follows the population. The densest clusters of dots match the biggest metro areas, but rural states have plenty of active areas too.
What this means for your store
If you sell apparel or other everyday goods:
- Expect the most pickup orders from customers in metros and dense metros, where adoption is highest.
- Don't write off rural customers: about 1 in 11 still chose pickup.
- In city-heavy markets, lead with security ("held safely until you pick it up").
- Your strongest pickup audience is suburban and urban customers: about 1 in 6 chose pickup.
- Rural wine buyers use pickup more than you might expect (13.4%). For them, a missed signature can mean another long wait for the next attempt.
- In dense metros, pickup at checkout alone won't reach most customers. A redirect offer after a missed delivery, or before the order ships, is a better fit there.
How to measure pickup adoption in your own data
- Export orders with the shipping ZIP code and whether the order went to a pickup location.
- Group ZIP codes by density. A simple version: rural, suburban and urban using the Census urban-area flag, plus your biggest metro areas as their own group.
- Calculate the pickup share per group (pickup orders ÷ all orders in that group).
- Split by product category if you sell more than one kind of product. As the wine and apparel curves show, categories can move in opposite directions.
- Re-check after peak season. December orders include many gifts sent to other addresses, which can shift the mix.
Via.Delivery's solution
These numbers come from orders shipped through Via.Delivery, which adds 36,000+ FedEx and UPS pickup locations to online store checkouts. Shoppers see the nearest locations next to your other shipping options, and packages are held for up to 7 days with reminders until they're collected. For wine, shoppers only see the roughly 20,000 locations that accept alcohol, and the recipient shows ID (21+) at the counter.
Three ways to offer pickup, depending on where your customers are:
Want to see how pickup would work for your customers? Book a demo.
Three ways to offer pickup, depending on where your customers are:
- Pickup at Checkout: pickup locations as a shipping option when the customer orders.
- Pickup Redirect: before the order ships, the customer gets an email offering a nearby location. Useful for wine club shipments.
- Missed Delivery Redirect: after a failed delivery, the customer can send the package to a pickup location instead of waiting for another attempt. A good fit for dense metros, where fewer wine buyers choose pickup up front.
Want to see how pickup would work for your customers? Book a demo.
FAQ
What share of online shoppers choose pickup locations?
When stores offer FedEx and UPS pickup at checkout, 10% to 15% of shoppers choose it nationwide. In this analysis, the average was 10.64% for apparel and 13.87% for wine.
Do rural shoppers use pickup locations?
Yes. 9.1% of rural apparel shoppers and 13.4% of rural wine shoppers chose pickup.
Where is pickup most popular?
It depends on the product. For apparel, adoption is highest in dense metros (13.7%). For wine, it's highest in suburban (16.3%) and urban (15.5%) areas.
Why do fewer wine buyers choose pickup in dense metros?
Our read is that it reflects driving versus walking habits: a 6- or 12-bottle box is easy to collect by car but hard to carry home on foot or by subway. Many buildings in dense cities also have a concierge or doorman who can be there for the delivery.
Is pickup only popular in big cities?
No. Areas where 15% or more of shoppers choose pickup appear across the country, including smaller cities and rural regions.
How can I find out how my own customers would use pickup?
Group your orders by ZIP code and population density, and check where theft claims and missed deliveries are highest. Those areas usually show the strongest pickup demand.
Sources
- Pickup location data — Via.Delivery
- Nation's Urban and Rural Populations Shift Following 2020 Census — U.S. Census Bureau, Dec 29, 2022
Keep reading
 Why Urban Areas Need PUDO Networks More Than EverDiscover why PUDO networks are essential for urban logistics, reducing last-mile delivery costs, failed deliveries, and porch…Read the article →
 Buy Online, Pick Up Anywhere and Repeat Purchase RatesHow Buy Online, Pick Up Anywhere affects repeat purchases: fewer failed deliveries, a smoother first order, and what to…Read the article →
 The Hidden Cost of Adult Signature: Lost Wine Club MembersA missed adult-signature delivery can cost a winery a club member worth $1,800+ in future profit. How to calculate the loss…Read the article →
Not ready for a call?
Get the Via.Delivery Shipping Brief: short reads on carrier fees, holiday cutoffs and pickup options for online stores and wineries, twice a month.
No spam. Unsubscribe anytime.