





Pickup Location Data
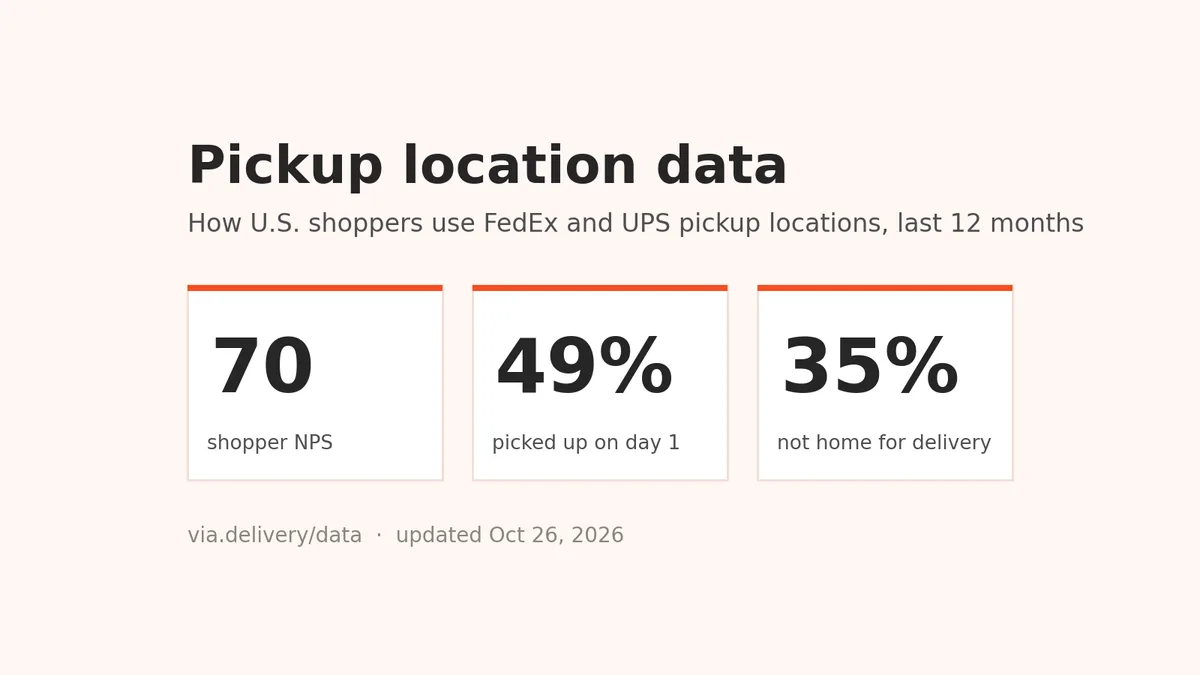
Data from Oct 27, 2025 to Oct 26, 2026. Updated Oct 26, 2026; refreshed every two months.
Why shoppers choose pickup
Share of survey answers, Oct 27, 2025 to Oct 26, 2026.
| Reason for choosing pickup | Share of answers |
|---|---|
| Not at home for deliveries | 34.6% |
| Fast delivery | 19.0% |
| Secure, no porch theft | 16.5% |
| Less expensive | 16.1% |
| Greener delivery | 4.2% |
| Didn't understand the option | 2.5% |
| No other option offered | 2.4% |
| Out of town | 2.2% |
| Temperature-sensitive item | 1.2% |
| Privacy or gifting | 1.2% |
How many shoppers choose pickup at checkout
| Product category | Lowest store | Highest store | Average |
|---|---|---|---|
| Wine and other signature-required products | 12% | 26% | 16% |
| High-end accessories | 10% | 16% | 12% |
| Apparel | 6% | 13% | 8% |
| Giftable merchandise | 5% | 9% | 7% |
Pickup at checkout increases sales
Via.Delivery A/B tests of checkouts with and without pickup locations.
How fast shoppers collect their packages
Share of packages collected on each day after they arrive at the location. Running total: 49% by day 1, 68% by day 2, 80% by day 3, 88% by day 4, 93% by day 5. Oct 27, 2025 to Oct 26, 2026.
Packages that are never collected
Shopper satisfaction (NPS)
Monthly NPS (average of daily scores). Oct 2026 covers its first 26 days. Hover a column for its value; all values are in the table below.
| Month | NPS |
|---|---|
| Nov 2025 | 70.2 |
| Dec 2025 | 64.5 |
| Jan 2026 | 70.6 |
| Feb 2026 | 67.8 |
| Mar 2026 | 72.2 |
| Apr 2026 | 72 |
| May 2026 | 68.9 |
| Jun 2026 | 71.2 |
| Jul 2026 | 72.2 |
| Aug 2026 | 69.7 |
| Sep 2026 | 70.7 |
| Oct 2026 (partial) | 71.9 |
Lost, stolen and damaged packages
Share of packages that had to be replaced. Case study of an apparel retailer with six online stores.
Where shoppers use pickup locations
Share of all packages delivered to pickup locations, Oct 27, 2025 to Oct 26, 2026.
| Rank | State | Share of pickup packages |
|---|---|---|
| 1 | California | 10.8% |
| 2 | Florida | 8.5% |
| 3 | Texas | 7.4% |
| 4 | New York | 6.4% |
| 5 | Pennsylvania | 5.5% |
| 6 | Ohio | 4.1% |
| 7 | Illinois | 3.8% |
| 8 | Massachusetts | 3.5% |
| 9 | Virginia | 3.5% |
| 10 | New Jersey | 3.4% |
| Rank | City | Share of pickup packages |
|---|---|---|
| 1 | Chicago, IL | 0.9% |
| 2 | Houston, TX | 0.8% |
| 3 | Charlotte, NC | 0.6% |
| 4 | Miami, FL | 0.6% |
| 5 | San Diego, CA | 0.5% |
| 6 | San Francisco, CA | 0.5% |
| 7 | New York, NY | 0.5% |
| 8 | Atlanta, GA | 0.5% |
| 9 | Dallas, TX | 0.5% |
| 10 | Pittsburgh, PA | 0.5% |
How far shoppers travel
What would these numbers look like for your store?We can estimate how many of your customers would choose pickup and what it saves on delivery surcharges and replacements.
About this data
- Source: orders shipped to FedEx Hold at Location and UPS Access Point locations through Via.Delivery, all stores combined. No single store's numbers are shown.
- Period: Oct 27, 2025 to Oct 26, 2026 (12 months), unless a section says otherwise. Adoption by category, distance, the A/B test and the loss-rate case study come from earlier Via.Delivery analyses.
- Survey: reasons and NPS come from a short optional survey shoppers receive after pickup.
- Updates: every two months. Last updated Oct 26, 2026.
- How to cite: "Via.Delivery, Pickup Location Data, updated Oct 26, 2026, https://via.delivery/data".
FAQ
Why do online shoppers choose pickup locations?
What share of customers choose pickup at checkout?
Does offering pickup at checkout increase sales?
How quickly do customers pick up their packages?
How many pickup packages are never collected?
Are packages safer at a pickup location than at the door?
How often is this data updated?
Not ready for a call?
Get the Via.Delivery Shipping Brief: short reads on carrier fees, holiday cutoffs and pickup options for online stores and wineries, twice a month.
No spam. Unsubscribe anytime.